
Understanding the Vaaniq Dashboard Analytics
Read your message volume, delivery quality, and engagement trends from the Analytics dashboard.
Intermediate 4 min read
Tutorial video coming soon
What You'll Learn
In this tutorial you'll learn:
- Read the overview KPIs and daily trend charts
- Use a date range to focus on a specific period
Step-by-Step Guide
1
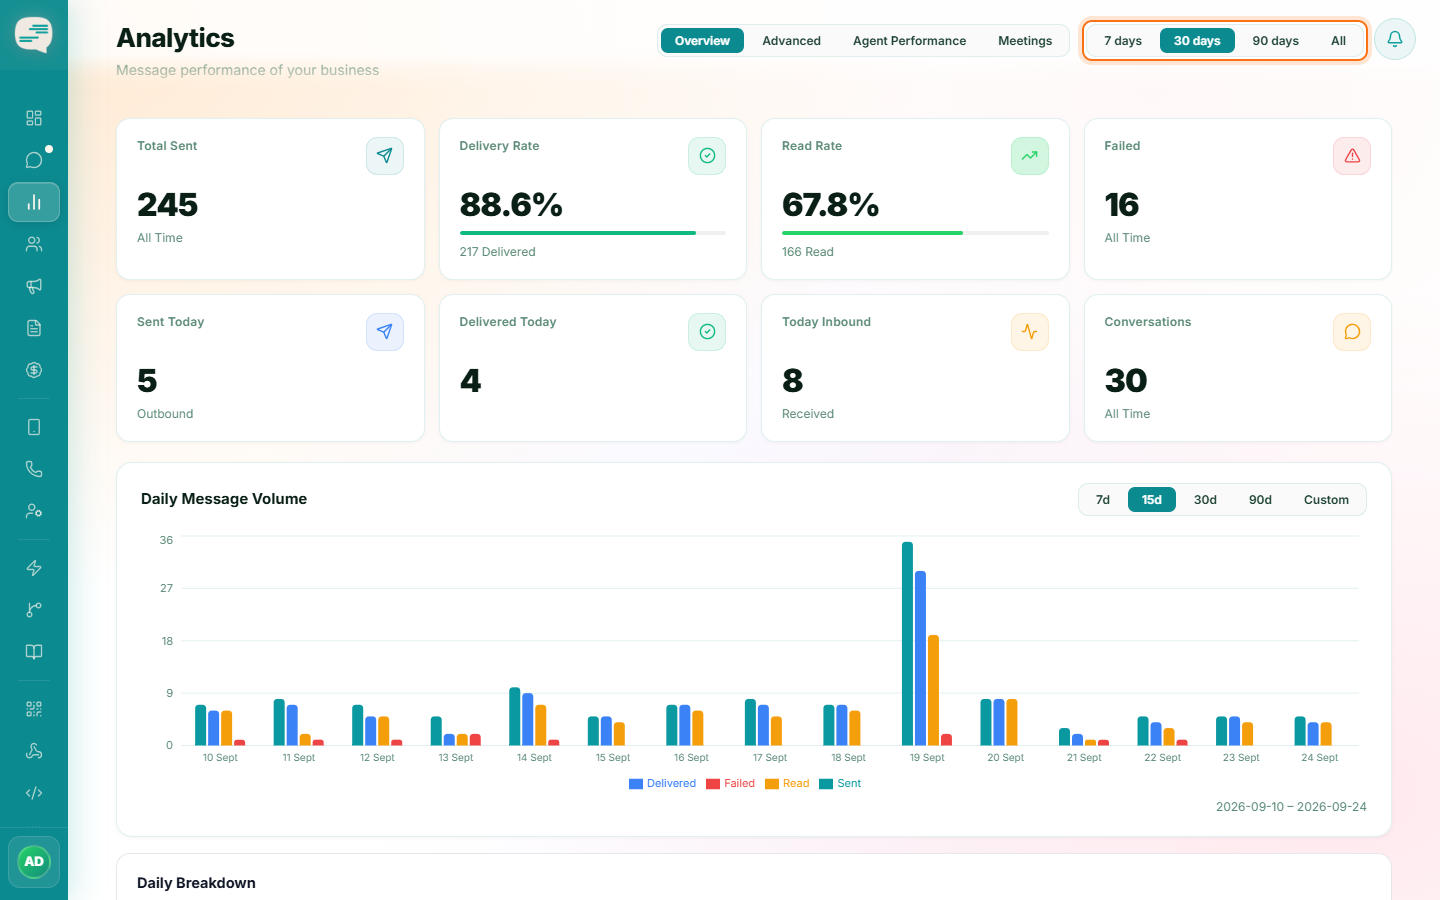
Open Analytics
Dashboard → Analytics
See total messages sent, delivered, read, and failed for the selected date range.
2
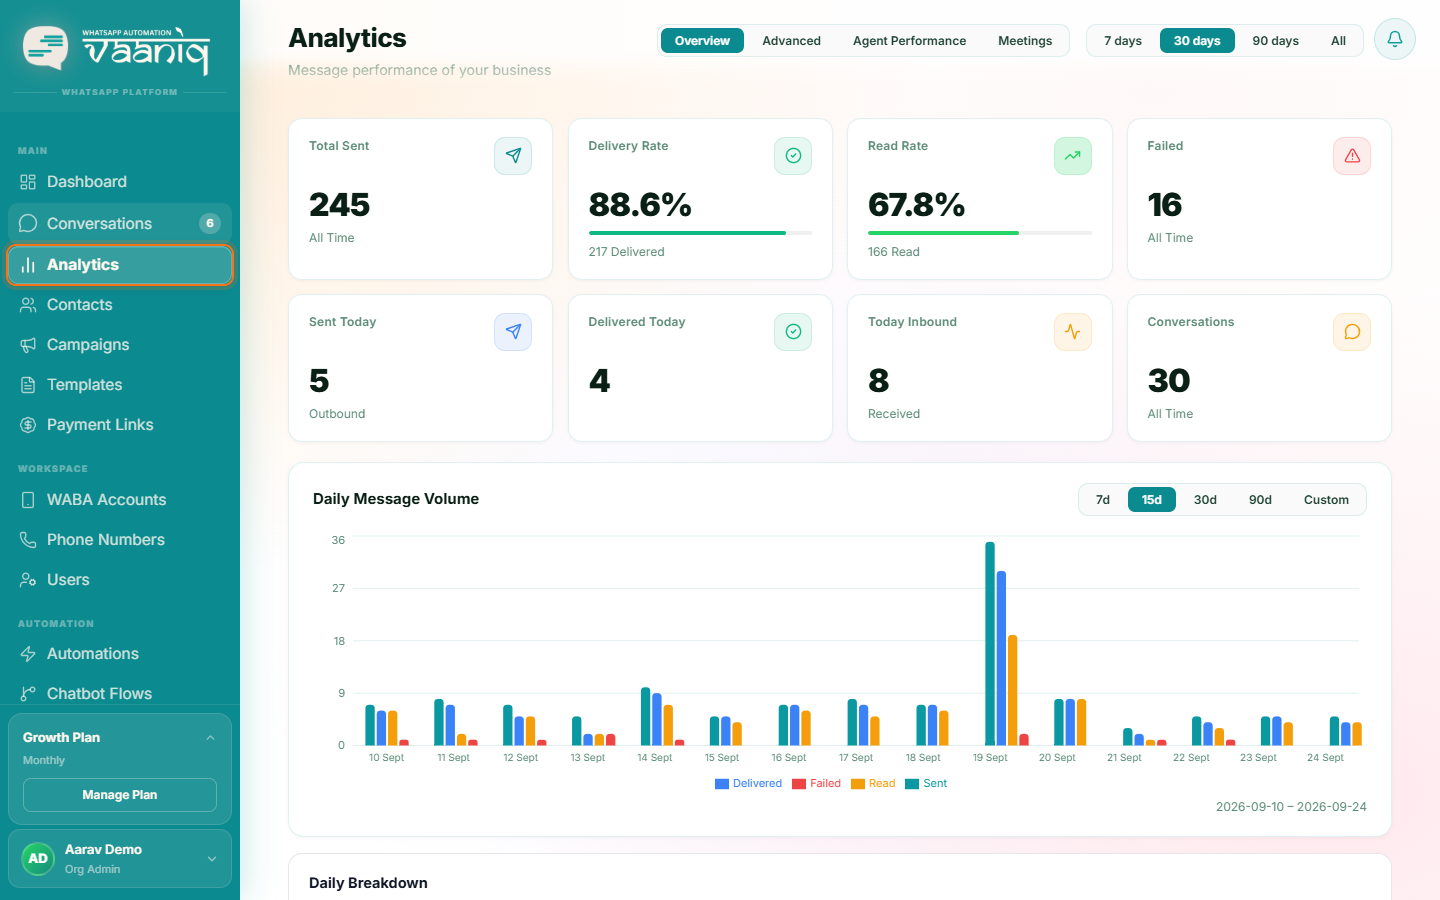
Explore trends
Daily trend charts plot message volume and delivery rate over time, alongside a breakdown by message type and a delivery heatmap by hour and day.
3
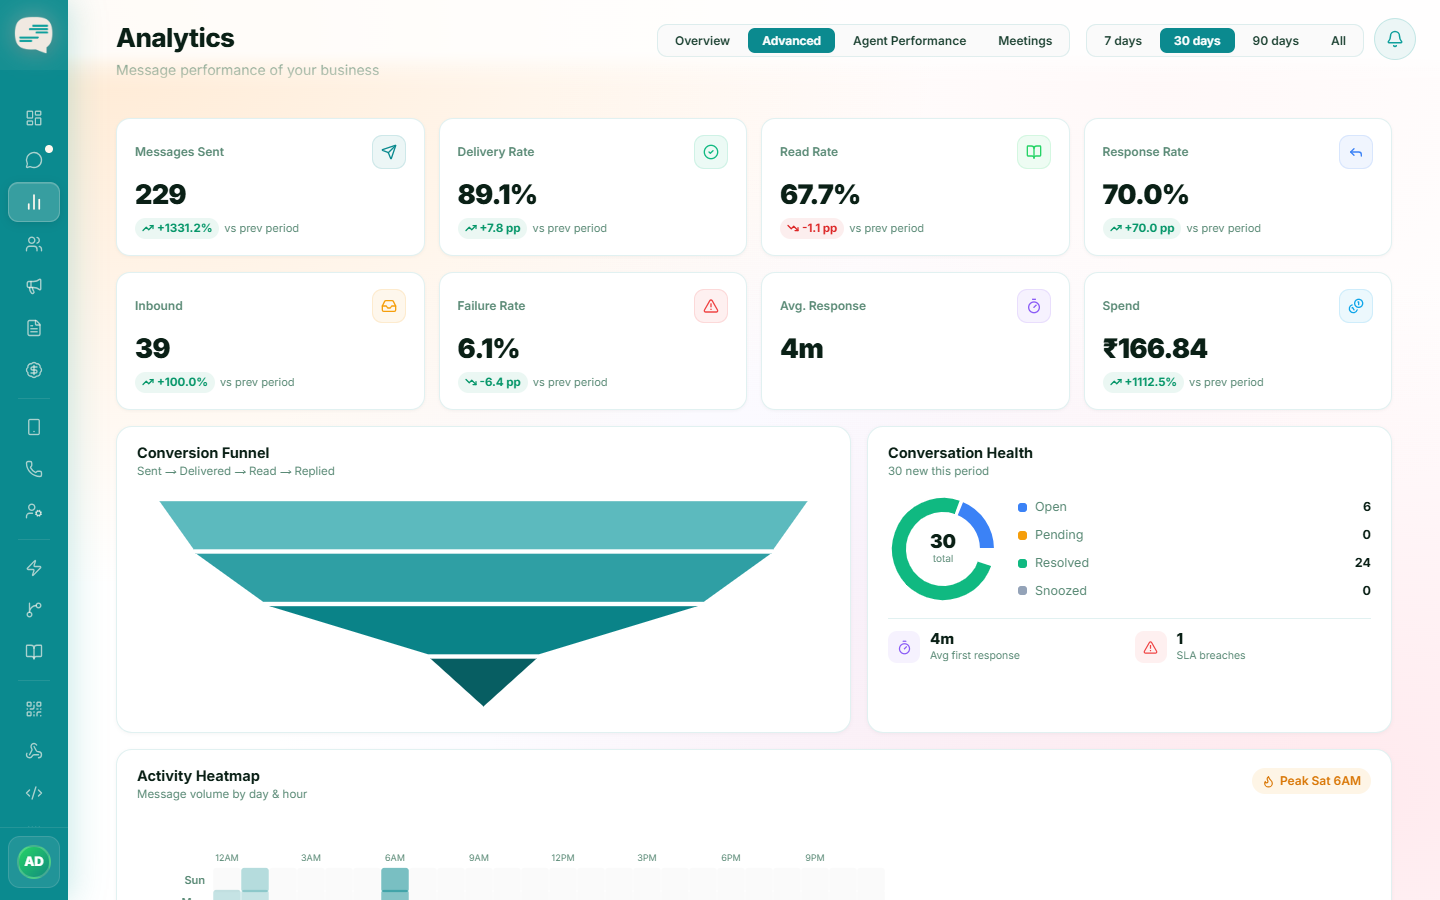
Change the date range
Use the preset ranges (7/30/90 days) or pick a custom range to focus on a specific period.