

How to Understand the Vaaniq Dashboard
A quick tour of your workspace home page — connected WABAs, phone numbers, templates, and conversations at a glance.
Tutorial video coming soon
What You'll Learn
In this tutorial you'll learn:
- Know what each stat card links to
- Find Quick Actions for common next steps
- See your connected WABAs and phone numbers at a glance
Step-by-Step Guide
Open your Dashboard
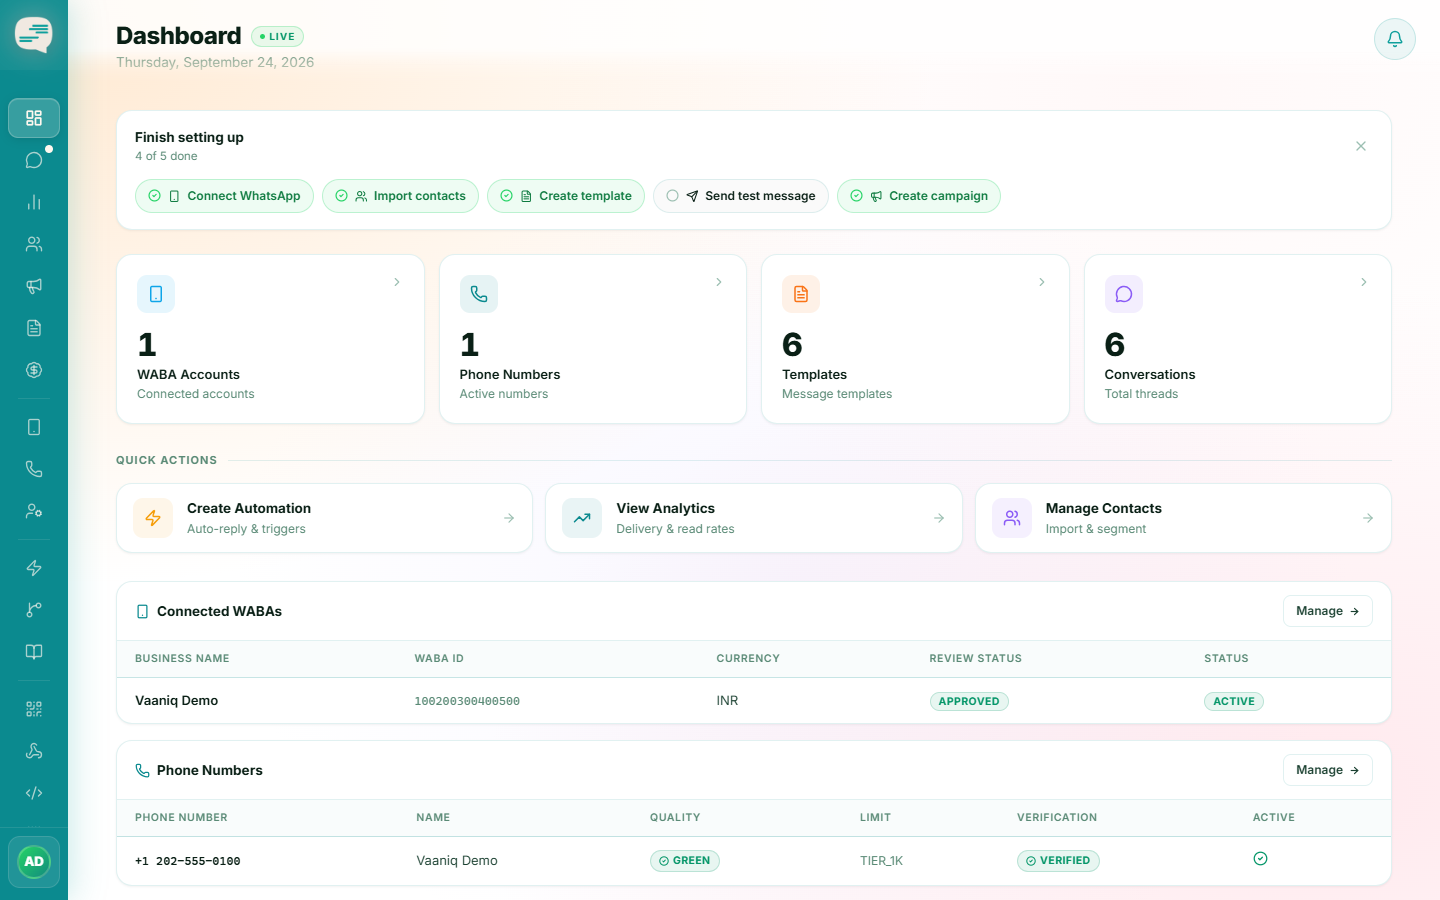
Your Dashboard is your workspace home page, shown right after logging in. At the top is your onboarding checklist (until you complete it), followed by four stat cards: WABA Accounts, Phone Numbers, Templates, and Conversations — each links straight to its own page.
Use Quick Actions
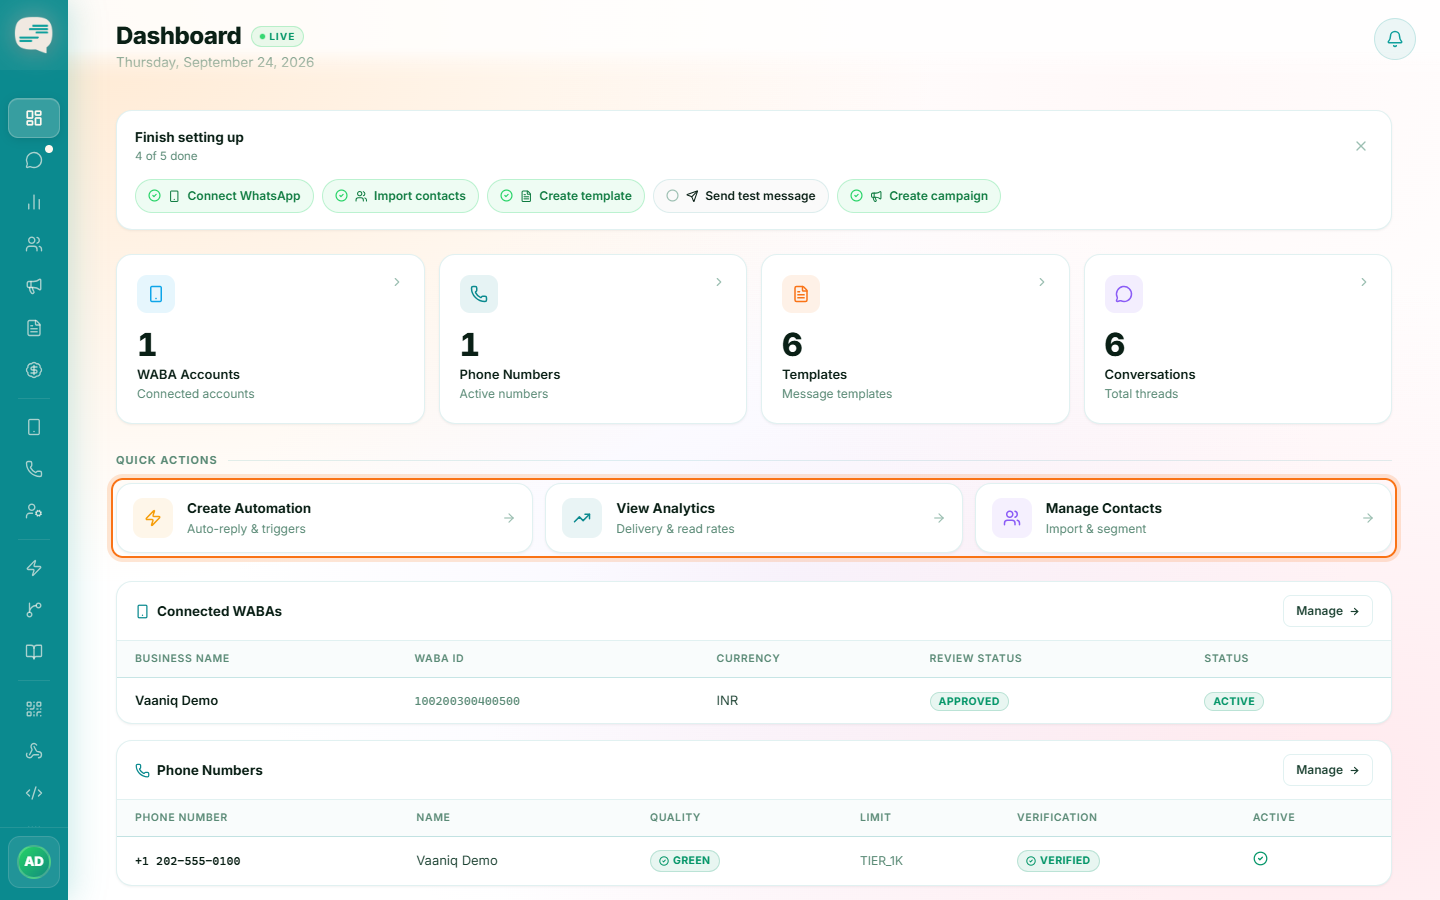
Below the stat cards, the Quick Actions row gives one-click shortcuts to Create Automation, View Analytics, and Manage Contacts.
Check your connected infrastructure
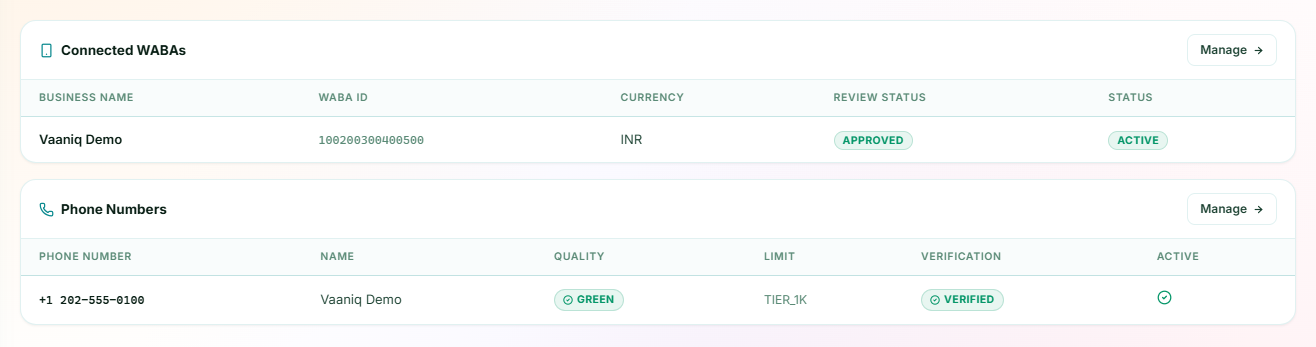
Further down, the Connected WABAs and Phone Numbers tables show your business name, WABA ID, currency, review status, quality rating, and verification status at a glance — with an empty-state prompt to connect one if you haven't yet.
Wallet balance and message-volume analytics live on their own dedicated pages (Wallet and Analytics), not directly on the Dashboard.